Dogwhelk example:
Ecoprojects example:
Nucella lapillus (Dogwhelk)
morphology : wave exposure
Analysis
Students t-test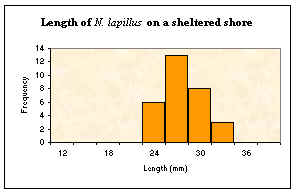
This is appropriate as frequency histograms suggest an approximately normal distribution
Null hypotheses:
-there is no significant difference in Nucella lapillus length / width / aperture length / shell length : aperture length ratio on shores of different wave exposure
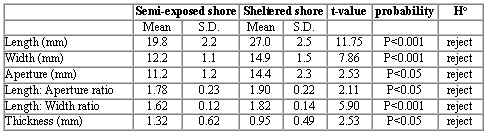
Sample size for each sample is 30 . Therefore degrees of freedom = 58
In all cases the calculated value is greater than the critical value at p=0.05, therefore the null hypotheses can be rejected.
Critical values t-distribution